


Imagine you’ve just completed twenty user interviews.
Your notes are everywhere.
Sticky notes cover your desk. Screenshots sit in folders. Quotes fill spreadsheets. Observations are scattered across documents.
You know valuable insights are hiding in that mountain of information.
The challenge is finding them.
That’s where affinity mapping comes in.
Affinity mapping is a research analysis technique used to organize large amounts of information into meaningful groups based on patterns, relationships, and themes. It helps teams make sense of qualitative data collected from user interviews, usability tests, surveys, customer feedback, workshops, and other research activities.
Instead of looking at hundreds of disconnected observations, teams can identify recurring behaviors, pain points, motivations, and opportunities.
In simple terms, affinity mapping turns research chaos into clarity.
Why Affinity Mapping Matters
Research generates information.
Lots of it.
The more users you talk to, the more data you collect.
At first glance, everything may seem random.
One participant complains about pricing.
Another struggles with navigation.
Someone else mentions trust concerns.
Individually, these observations are interesting.
Grouped together, they often reveal larger stories.
Affinity mapping helps teams discover patterns that might otherwise remain hidden.
Those patterns frequently become the foundation for design decisions, product improvements, and business strategies.
A Technique with an Interesting History
Affinity mapping originated from the KJ Method, developed by Japanese anthropologist and researcher Jiro Kawakita.
His approach focused on organizing large amounts of information into meaningful categories through observation and grouping.
Over time, the technique became widely adopted in design thinking, product development, customer experience research, and UX design.
Today, affinity mapping is considered one of the most useful methods for analyzing qualitative research.
So How Does Affinity Mapping Actually Work?
Here’s the basic idea.
Every observation gets written on an individual note.
One note equals one insight.
Teams then review all notes and begin grouping similar observations together.
As clusters emerge, larger themes become visible.
It’s surprisingly simple.
Yet the results can be powerful.
Think of it like sorting thousands of photographs.
At first, everything feels disorganized.
Then categories begin to form naturally.
Family photos.
Vacation pictures.
Birthday celebrations.
Nature shots.
Suddenly the collection becomes easier to understand.
Affinity mapping works in much the same way.
The Building Blocks of an Affinity Map
Several elements typically appear in an affinity mapping session.
Research Observations
These are raw findings collected during research.
Examples include:
- User quotes
- Pain points
- Behaviors
- Feedback
- Questions
- Frustrations
Each observation is written separately.
Sticky Notes
Physical or digital sticky notes are commonly used.
Keeping observations separate makes grouping easier.
Most teams use one note per insight.
Clusters
As patterns emerge, related notes are grouped together.
These groups become clusters.
For example:
A group of notes discussing confusion during checkout may form a cluster called “Checkout Issues.”
Themes
Clusters often combine into larger themes.
Several checkout-related clusters might eventually become a broader theme called “Purchase Experience.”
Themes provide a high-level view of user needs and challenges.
Step-by-Step Affinity Mapping Process
Let’s break the process into manageable steps.
Step 1: Gather Research Data
The process starts after research is completed.
Sources may include:
- User interviews
- Customer support tickets
- Surveys
- Usability tests
- Product reviews
- Feedback forms
The goal is collecting meaningful observations.
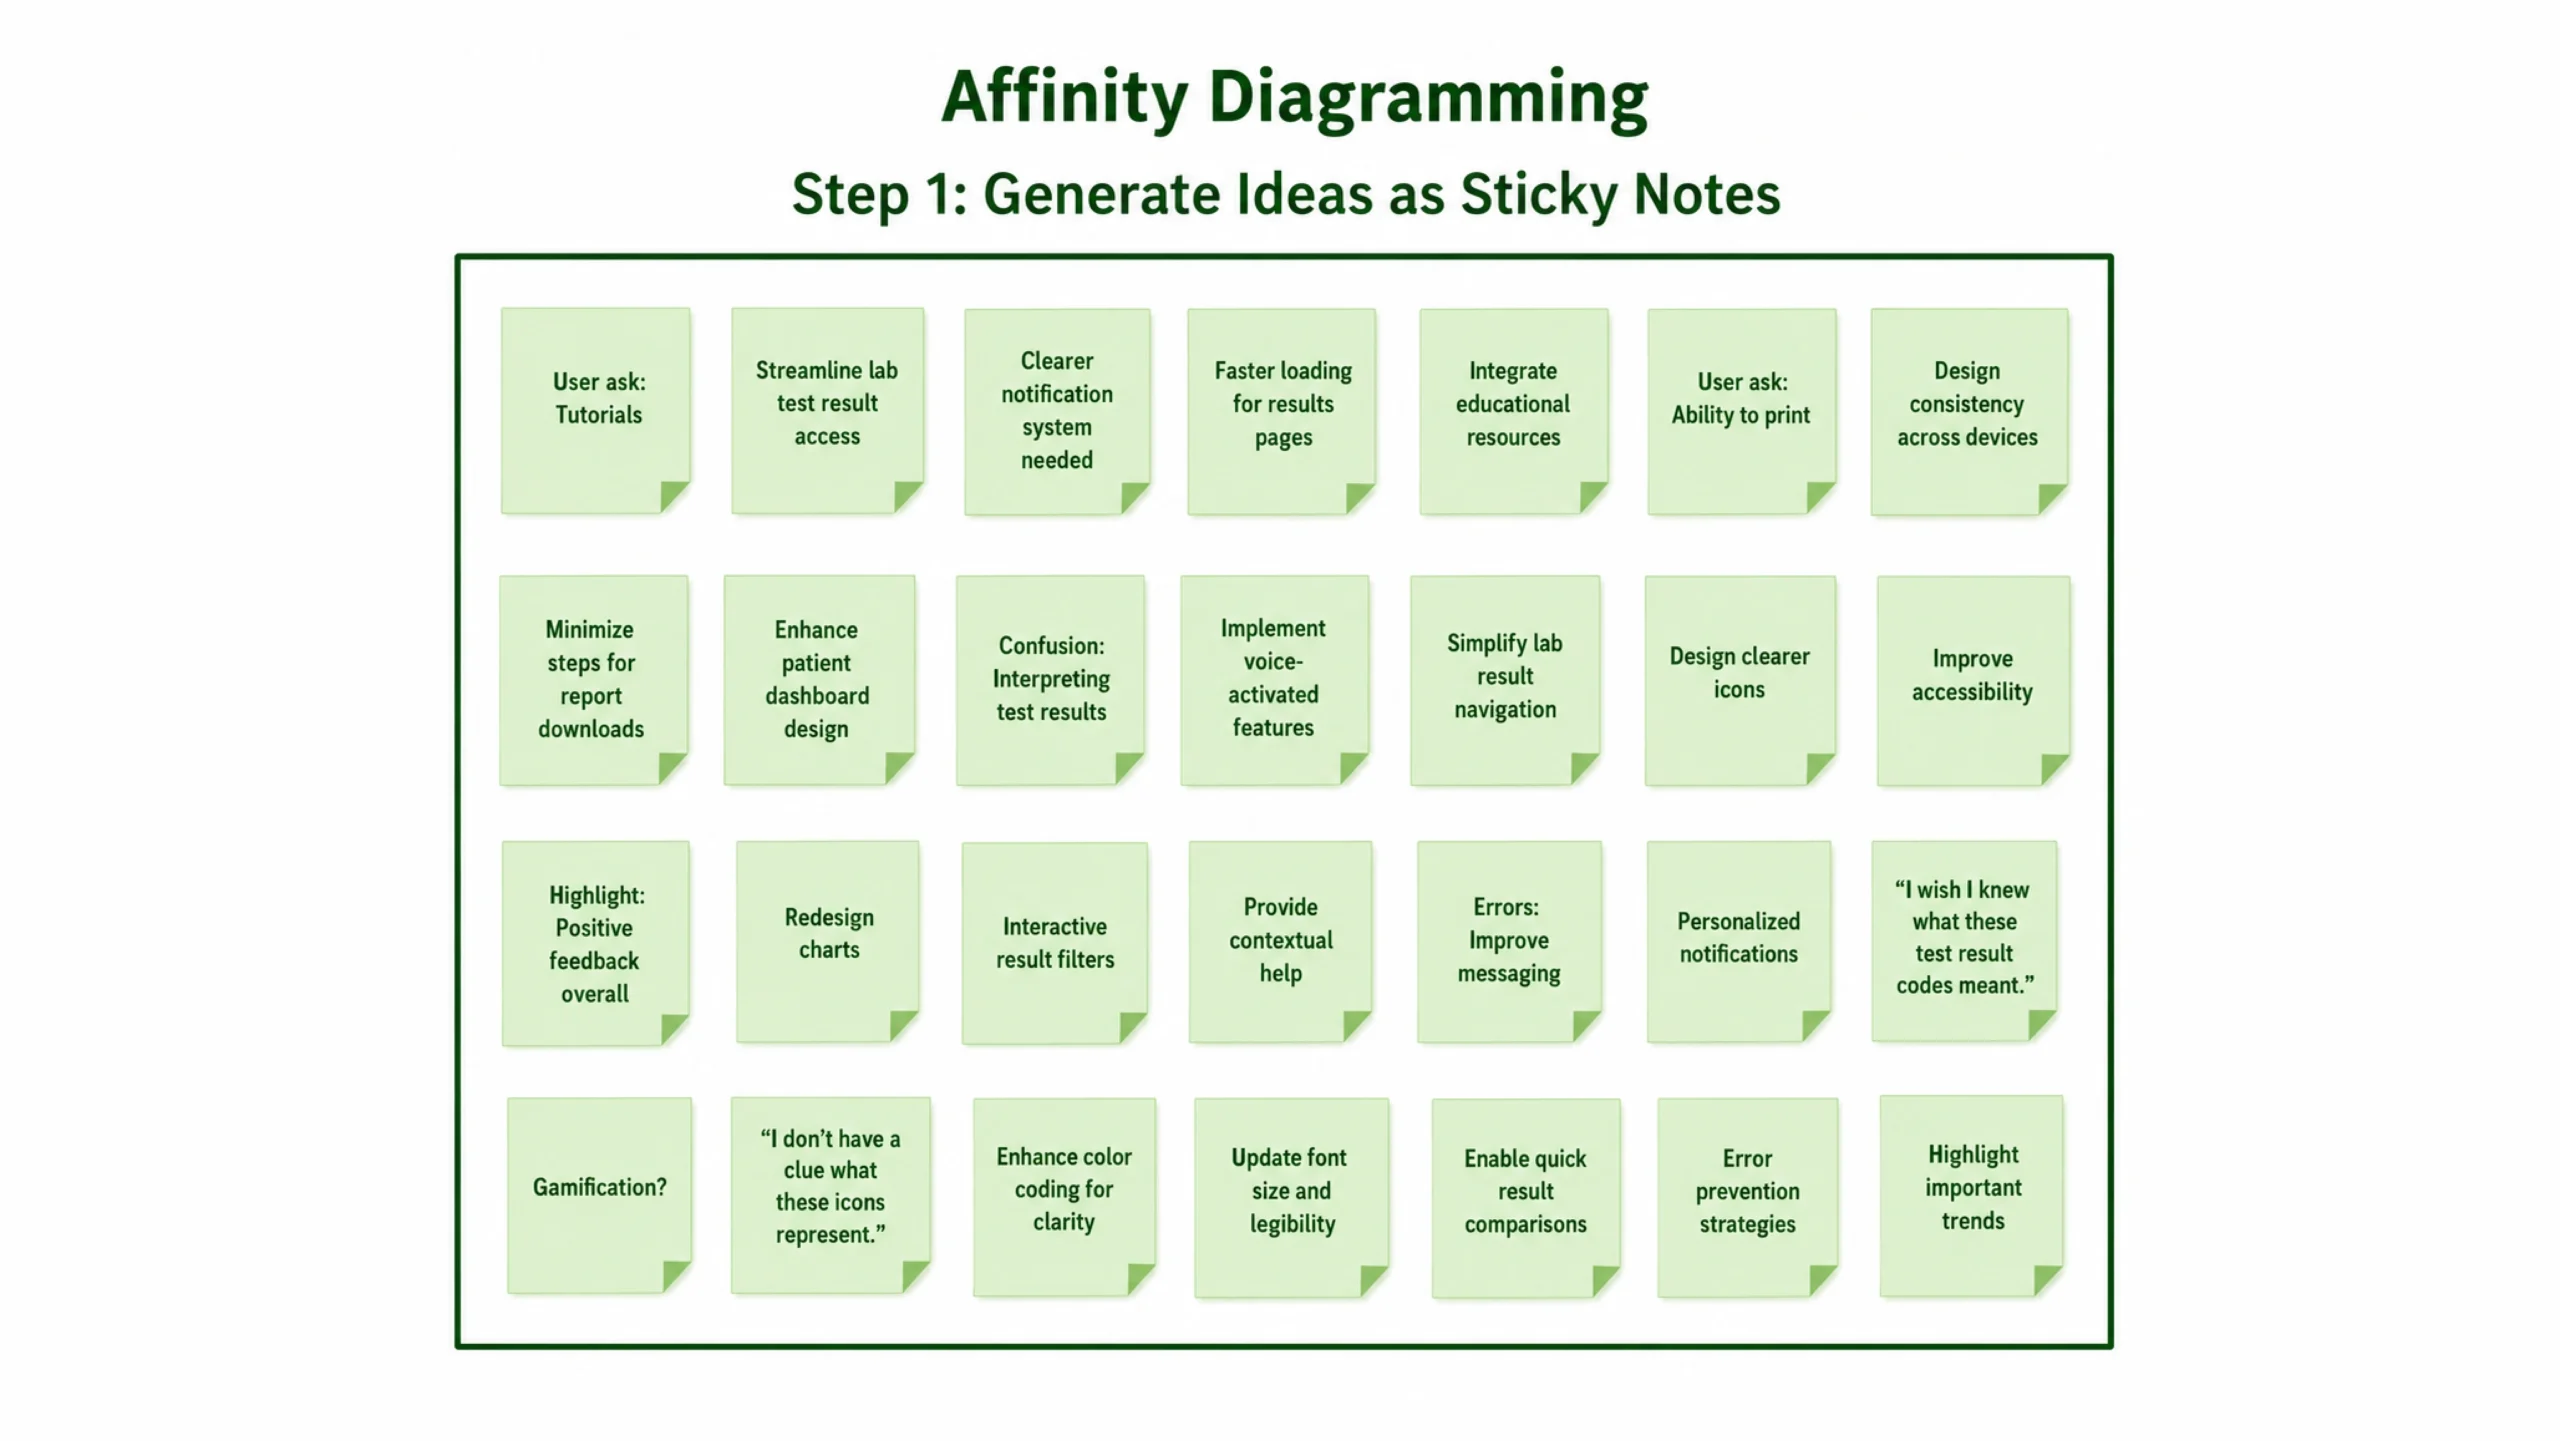
Step 2: Write Individual Notes
Every observation gets recorded separately.
Examples might include:
- “Users cannot find account settings.”
- “Participants expect faster checkout.”
- “Customers want more payment methods.”
Keeping notes short improves readability.
Step 3: Place Notes Together
All notes are displayed in one shared space.
This could be:
- A wall
- A whiteboard
- A virtual workspace
At this stage, no categories exist.
Everything remains unorganized.
Step 4: Group Similar Insights
The team begins moving notes into related clusters.
Patterns gradually emerge.
This part often feels a bit messy.
That’s normal.
The goal isn’t perfection.
The goal is discovering relationships.
Step 5: Name the Groups
Once clusters become stable, descriptive labels are added.
Examples include:
- Navigation Problems
- Trust Concerns
- Mobile Experience Issues
- Pricing Questions
Labels help communicate findings clearly.
Step 6: Identify Larger Themes
Clusters can then be combined into broader categories.
This creates a hierarchy of insights that supports decision-making.
The result is a structured view of user needs.
When Should You Use Affinity Mapping?
Affinity mapping works particularly well after research activities.
Common scenarios include:
After User Interviews
Interview findings often generate dozens or hundreds of observations.
Affinity mapping helps reveal recurring themes.
After Usability Testing
Testing sessions produce valuable feedback.
Grouping issues helps identify the most common usability problems.
During Design Thinking Workshops
Many teams use affinity mapping after brainstorming sessions.
It helps organize ideas before selecting solutions.
Customer Feedback Analysis
Reviews, support requests, and survey responses can be analyzed using affinity maps.
Patterns often reveal hidden opportunities.
Why UX Teams Love Affinity Mapping
There are several reasons this method remains popular.
It Turns Data into Insights
Raw data alone rarely drives decisions.
Affinity mapping helps transform observations into actionable findings.
It Reduces Bias
Patterns emerge from actual research rather than assumptions.
This keeps discussions grounded in evidence.
It Creates Shared Understanding
Designers, developers, product managers, marketers, and stakeholders can all participate.
Everyone sees the same findings.
Everyone works from the same source of truth.
It Reveals Hidden Opportunities
Small observations often connect in unexpected ways.
These connections can inspire new features, services, or design improvements.
Common Affinity Mapping Mistakes
Even experienced teams can make mistakes.
Here are a few worth avoiding.
Grouping Too Quickly
Rushing the process can force unrelated observations together.
Patterns should emerge naturally.
Creating Categories Too Early
Predetermined categories may influence analysis.
It’s often better to let themes appear organically.
Using Vague Labels
Labels such as “Problems” or “Issues” don’t provide much context.
Specific labels make findings easier to understand.
Ignoring Minority Insights
A theme doesn’t need to appear frequently to matter.
Sometimes a small group highlights a critical issue.
Affinity Mapping in UX Design
Affinity mapping plays a major role in user experience work.
UX researchers often use it after:
- User interviews
- Contextual inquiries
- Diary studies
- Field research
- Usability testing
The resulting insights influence:
- Personas
- User journey maps
- Information architecture
- User flows
- Product strategy
Many successful digital products are shaped by patterns discovered through affinity mapping.
Popular Affinity Mapping Tools
Years ago, teams covered walls with sticky notes.
Many still do.
Digital collaboration tools have made remote affinity mapping much easier.
Popular options include:
- Miro
- FigJam
- Mural
- Lucidspark
- Figma
- Microsoft Whiteboard
These tools allow teams across different locations to collaborate in real time.
A Real-World Example
Imagine a team building a fitness tracking app.
Researchers interview twenty users.
After analysis, they collect more than two hundred observations.
Affinity mapping reveals several recurring themes:
- Users want simpler goal setting.
- Users struggle to understand progress reports.
- Users feel overwhelmed by notifications.
- Users want stronger social features.
Without affinity mapping, these insights might remain buried inside interview transcripts.
With affinity mapping, priorities become obvious.
The team knows exactly where improvements are needed.
Why Affinity Mapping Remains So Valuable
Research without analysis is like collecting puzzle pieces and never assembling them.
The pieces exist.
The picture doesn’t.
Affinity mapping helps teams connect those pieces.
It organizes information, uncovers patterns, and transforms scattered observations into meaningful insights.
For UX designers, product managers, researchers, marketers, and business teams, it remains one of the most practical ways to understand what users are truly saying—and sometimes what they aren’t saying directly.
That’s why affinity mapping continues to be a cornerstone of modern user research and design thinking.
Frequently Asked Questions (FAQs)
1. What is affinity mapping in UX research?
Affinity mapping is a method used to organize research findings into groups based on similar themes, helping teams identify patterns and insights.
2. Why is affinity mapping important?
It helps transform large amounts of qualitative data into meaningful insights that support product and design decisions.
3. When should affinity mapping be used?
It is commonly used after user interviews, usability tests, surveys, brainstorming sessions, and customer feedback analysis.
4. What tools can be used for affinity mapping?
Popular tools include Miro, FigJam, Mural, Lucidspark, Figma, and Microsoft Whiteboard.
5. How does affinity mapping help UX designers?
It helps designers discover user needs, pain points, behaviors, and opportunities that guide design improvements.
6. What is the difference between affinity mapping and brainstorming?
Brainstorming generates ideas, while affinity mapping organizes ideas or research findings into meaningful categories and themes.